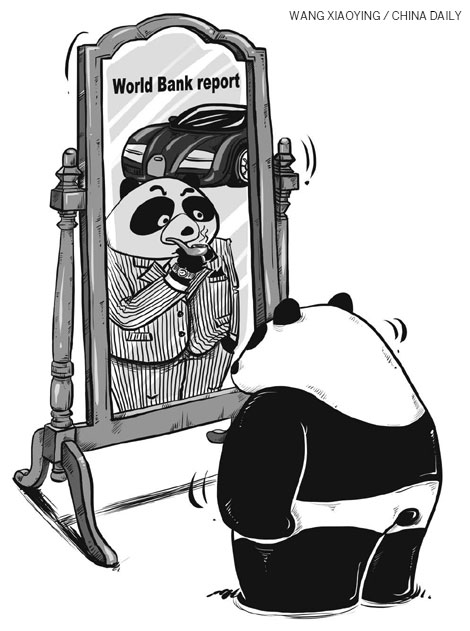
A new report by the World Bank's International Comparison Program (ICP) suggests that the purchasing power of the Chinese currency, based on 2011 prices, is significantly stronger than exchange rates indicate. If measured by the yuan's purchasing power, the report concludes, China will soon become the world's largest economy.
China's National Bureau of Statistics participated in the study, but rejected its conclusion, expressing "reservations" about the study's methodology.
The ICP provides useful data to compare living standards in different countries. But if it is used inappropriately to compare economies, the conclusions will be flawed.
|
 |
 |
The ICP figures are estimated according to purchasing power parity (PPP), which compares buying power in different countries. However, despite the unprecedented growth, per capita income differences (at 2005 PPP) remain deep between China and advanced economies. In 1980, just before Deng Xiaoping announced the reform and opening-up policies, China's per capita GDP (PPP) was $253. In the United States, the comparable figure was $12,576, in Japan, $8,611 and in Europe, somewhere between the two. In other words, living standards in China were then only 2 percent of those in the US, and 2.5-3 percent of those in Europe or Japan.
Last year, the comparable per capita income in the US was $51,749, in Japan, just less than $36,000, in the European Union, about $34,500, and in China, less than $9,900. By this measure, living standards in China are 20 percent of those in the US, and close to 30 percent of those in Japan or the EU, on average. Living standards in the US remain five times higher than those in China, and those in Japan and EU are more than three times as high as in China.
Furthermore, the concept of PPP allows us to compare individuals' and households' living standards in different countries. But it should not be used to compare different aggregate economies. After all, the PPP concept is not useful when you travel abroad. As every tourist knows only too well, foreign destinations do not exchange money on the basis of PPP. Only hard cash will do.
Based on GDP per capita (nominal), living standards in China are still only 12-13 percent of those in the US and Japan, and about 19 percent of those in the EU. China's economy will catch up with the US in due time. But it will take far longer for Chinese per capita income to catch up with that in major advanced economies.
